1. Spring Boot 애플리케이션에 Prometheus 메트릭 내보내기
1.1. 의존성 추가
1) Spring Boot Actuator - 애플리케이션의 다양한 지표(헬스 체크, 정보, 메트릭 등)를 제공하는 핵심 라이브러리
2) Micrometer Registry Prometheus - Micrometer를 통해 Actuator에서 수집한 메트릭을 Prometheus가 이해할 수 있는 형태로 노출

1.2. 설정 파일(yml) 변경
application.yml(혹은 application.properties)에서 Actuator 엔드포인트 설정 해주기
Prometheus가 수집할 수 있도록 /actuator/prometheus 엔드포인트를 공개해야 함
server:
  port: 8080

management:
  endpoints:
    web:
      exposure:
        include: "*"
  endpoint:
    prometheus:
      access: unrestricted
• include: "*"를 하면 모든 Actuator 엔드포인트가 열리지만, 보안 혹은 내부 운영 정책에 따라 필요한 엔드포인트만 열어주는 것이 좋음.
1.3. 애플리케이션 실행 후 확인
프로젝트를 실행한 뒤, 웹 브라우저 혹은 cURL을 통해 다음 URL로 접속.
http://localhost:8080/actuator/prometheus

2. Prometheus 설정 및 실행
Spring Boot 애플리케이션에서 /actuator/prometheus를 통해 지표가 잘 노출되는지 확인했다면, 이제 Prometheus 서버가 해당 엔드포인트를 스크레이핑하도록 설정해야 함.
2.1. Prometheus 다운로드
Prometheus 공식 GitHub Releases 페이지에서 OS/아키텍처에 맞는 버전을 다운로드 하기. (필자는 Mac)
#다운로드
wget https://github.com/prometheus/prometheus/releases/download/v2.42.0/prometheus-2.42.0.darwin-arm64.tar.gz
#압축해제
tar xvfz prometheus-2.42.0.darwin-arm64.tar.gz#해당폴더 이동
cd prometheus-2.42.0.darwin-arm64
2.2. Prometheus 설정 파일(prometheus.yml) 편집
압축을 해제하면 prometheus.yml 파일이 함께 제공되는데, 아래처럼 Spring Boot 애플리케이션을 스크랩하도록 설정을 추가하기.
# my global config
global:
  scrape_interval: 15s # Set the scrape interval to every 15 seconds. Default is every 1 minute.
  evaluation_interval: 15s # Evaluate rules every 15 seconds. The default is every 1 minute.
  # scrape_timeout is set to the global default (10s).

# Alertmanager configuration
alerting:
  alertmanagers:
    - static_configs:
        - targets:
          # - alertmanager:9093

# Load rules once and periodically evaluate them according to the global 'evaluation_interval'.
rule_files:
  # - "first_rules.yml"
  # - "second_rules.yml"

# A scrape configuration containing exactly one endpoint to scrape:
# Here it's Prometheus itself.
scrape_configs:
  # The job name is added as a label `job=<job_name>` to any timeseries scraped from this config.
  - job_name: "shoplink"
    scrape_interval: 15s

    # metrics_path defaults to '/metrics'
    # scheme defaults to 'http'.
    metrics_path: "/actuator/prometheus"
    static_configs:
      - targets: ["localhost:8080"]
2.3. Prometheus 서버 실행
#프로메테우스 서버 실행
./prometheus --config.file=prometheus.yml
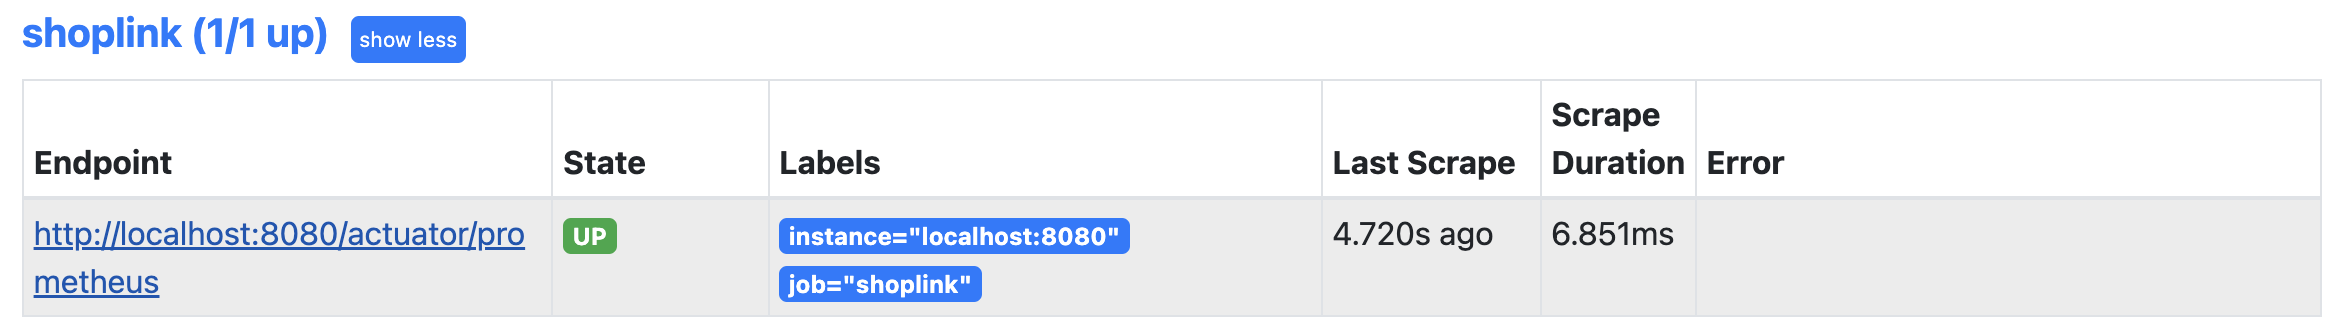
• 실행 로그를 보면 설정이 제대로 로드되었는지, 스크레이핑 대상에 제대로 접근되고 있는지를 확인할 수 있음.
• 웹브라우저에서 http://localhost:9090 으로 접속해 Status -> Targets 메뉴로 이동하면, UP 상태인지 확인이 가능함.
3. Grafana로 데이터 시각화
3.1. Grafana 다운로드/설치
#다운로드
curl -O https://dl.grafana.com/enterprise/release/grafana-enterprise-11.5.2.darwin-amd64.tar.gz
#압축해제
tar -zxvf grafana-enterprise-11.5.2.darwin-amd64.tar.gz#해당폴더 이동
cd grafana-v11.5.2#그라파나 서버 실행
./bin/grafana server
3.2. Grafana 첫 접속 및 Prometheus 데이터 소스 추가
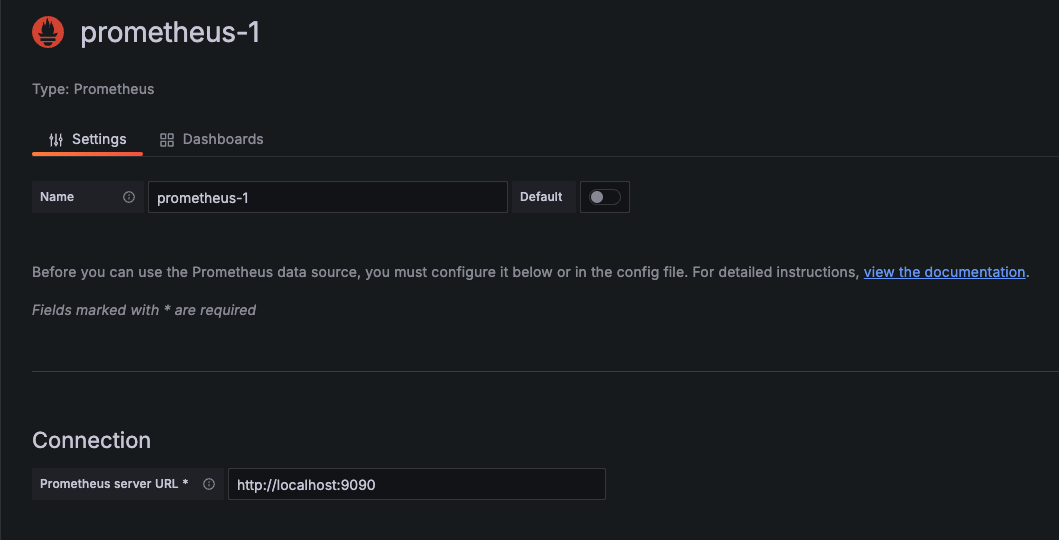
1) 웹 브라우저에서 http://localhost:3000 접속.
2) 기본 아이디/비밀번호: admin / admin (최초 로그인 시 비밀번호 변경해야 할 수 있음)
3) 좌측 사이드바에서 Connections -> Data Sources 선택
4) Add data source 버튼 클릭
5) 목록에서 Prometheus를 선택
6) Prometheus URL 예시: http://localhost:9090
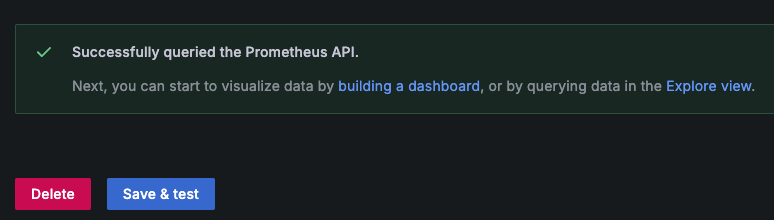
7) Save & Test 버튼을 눌러 성공 여부 확인


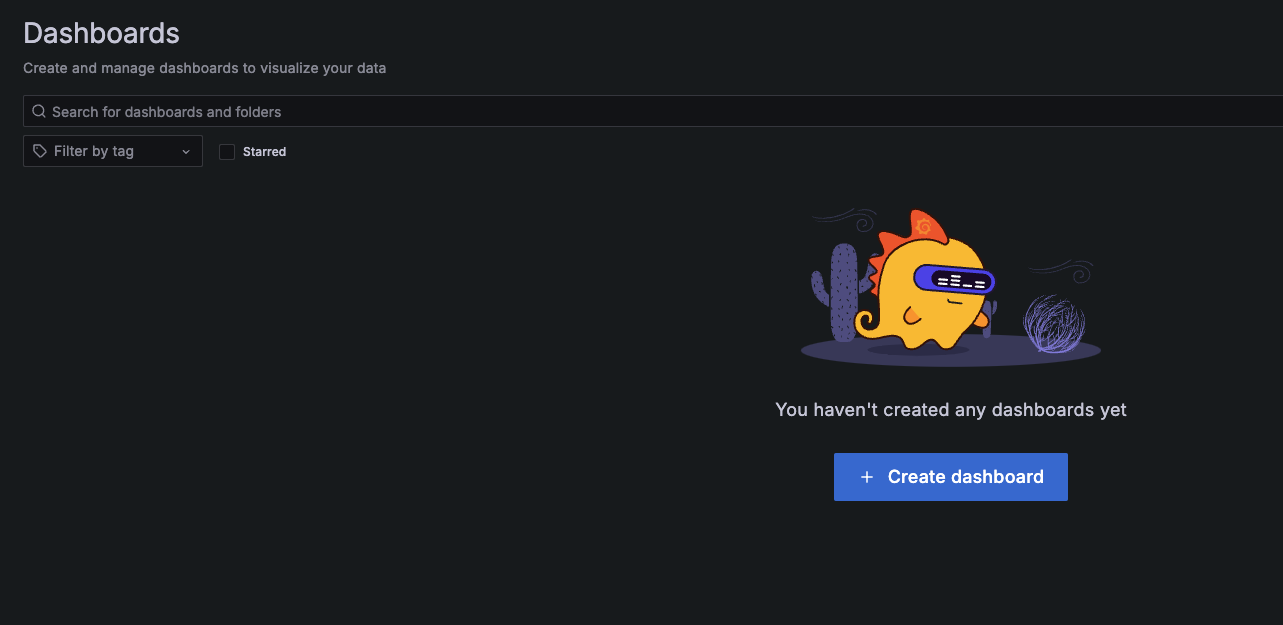
3.3. 대시보드 만들기
Prometheus 데이터를 Grafana에서 시각화하기 위해 새 대시보드를 만들기.
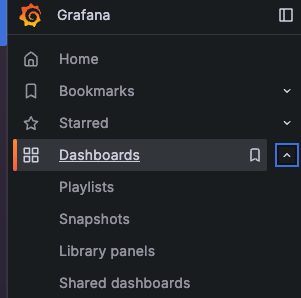
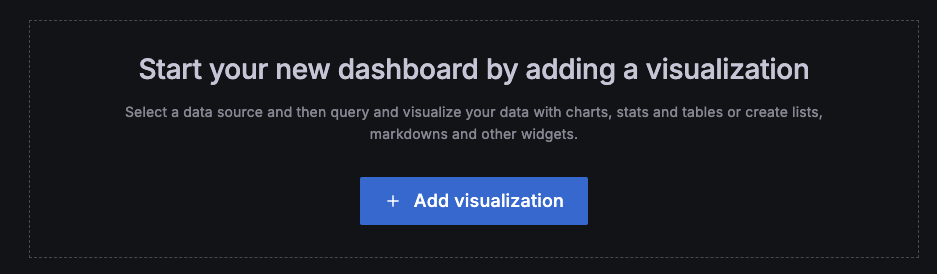
1. Create -> Dashboard 클릭
2. Add new panel 클릭
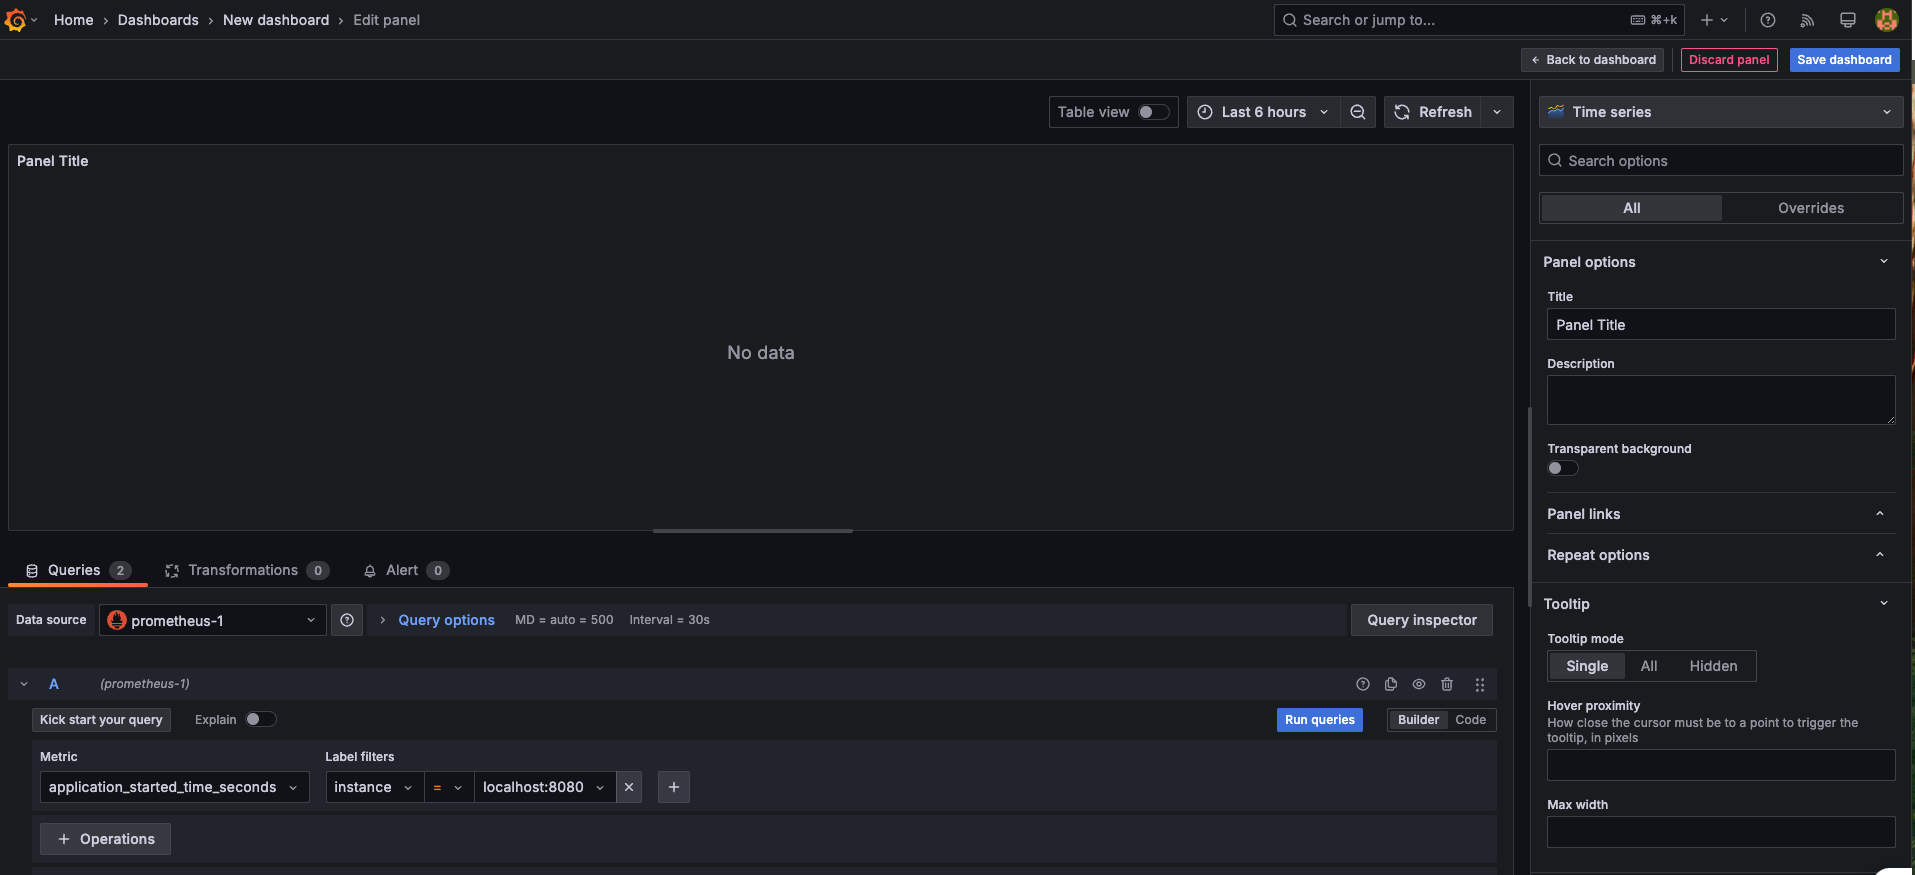
3. Query 부분에서 Prometheus 데이터 소스 선택
4. 예시:
• CPU 사용량(단순 예시): rate(process_cpu_seconds_total[1m])
• JVM Heap 사용률: jvm_memory_used_bytes{area="heap"}
• HTTP 요청 수: sum by (uri, method) (rate(http_server_requests_seconds_count[1m]))
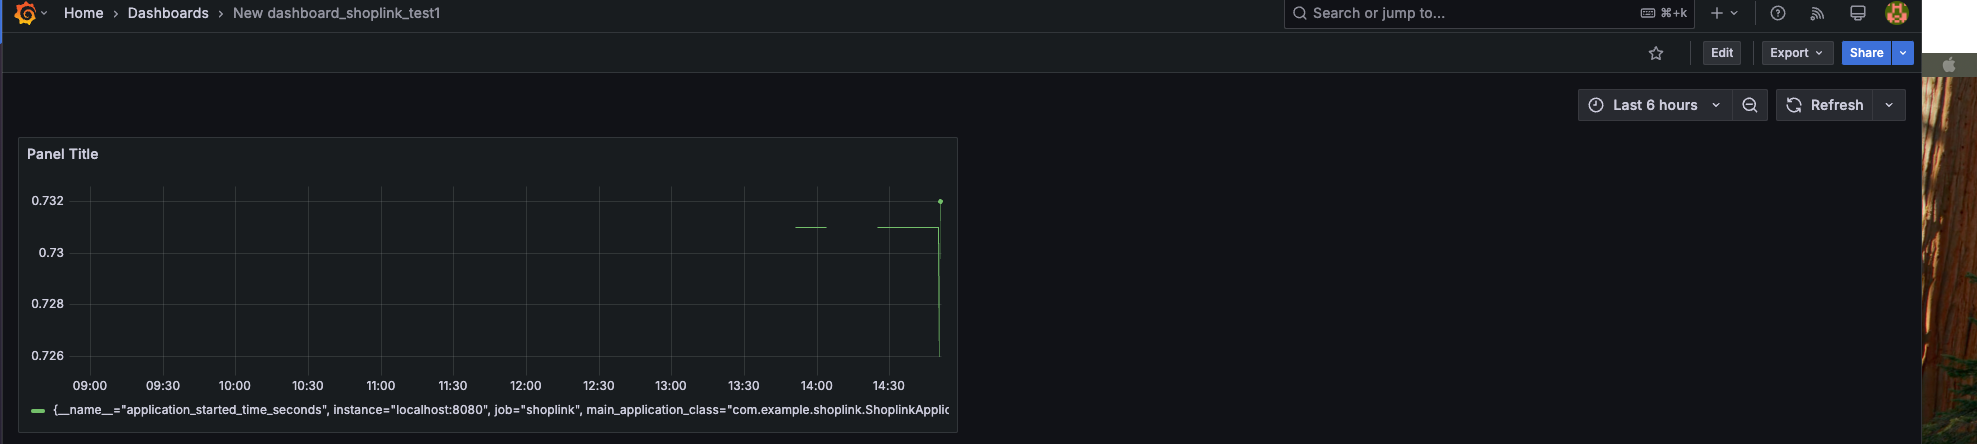
5. 그래프가 표시되는지 확인 후, Save 버튼을 눌러 대시보드를 저장
Spring Boot Actuator + Micrometer는 JVM 메모리, GC, 스레드, HTTP 요청, DB Connection Pool 등 다양한 지표를 기본적으로 노출함. 실제 운영 환경에서는 필요한 정보를 골라서 시각화하면 됨.
4. 구축 흐름 요약
1) Spring Boot 애플리케이션
• spring-boot-starter-actuator, micrometer-registry-prometheus 의존성 추가
• /actuator/prometheus로 메트릭 노출
2) Prometheus
• prometheus.yml에서 Spring Boot 애플리케이션의 메트릭 엔드포인트 설정 (예: localhost:8080)
• Prometheus 서버 실행
3) Grafana
• Prometheus를 데이터 소스로 설정
• 원하는 메트릭을 쿼리하여 대시보드 생성/시각화
5. 추가 고려사항
1) 보안
• /actuator/prometheus 엔드포인트에 인증/인가가 필요한지 여부를 검토해야 함.
• 운영 환경이라면 HTTPS 적용 여부, Prometheus->애플리케이션 통신 제한(IP 화이트리스트 등)도 고려대상.
2) 프로메테우스 스크레이핑 주기
• scrape_interval은 너무 짧으면 Prometheus 서버 부하가 커지고, 너무 길면 모니터링 응답성이 떨어짐.
• 일반적으로 15초 ~ 1분 사이 정도가 많이 쓰이는 설정.
3) 대시보드 템플릿
• Spring Boot + Prometheus를 위한 Grafana 대시보드 템플릿이 이미 오픈소스 커뮤니티나 Grafana Labs에서 공유됨.
• 필요한 템플릿을 가져와서 커스터마이징하면 빠르게 구축 가능.
4) 알람(Alerts)
• Prometheus에는 Alertmanager 연동을 통해 특정 지표가 임계값을 넘었을 때 Slack/이메일/Webhook 등으로 알람을 보낼 수 있음.
• Grafana의 Alerting 기능으로도 대시보드 기반 알람을 설정할 수 있음.
5) 운영 환경 배포
• Docker Compose나 Kubernetes를 사용하면 Spring Boot + Prometheus + Grafana를 한꺼번에 쉽게 구성할 수 있음.
• 각 컨테이너를 분리하여 유지보수/확장이 용이함.